It’s better to be approximately right than exactly wrong.”
– Carveth Read, 18th century author
In this article, we will cover:
- Knowing what to measure & which goals to focus on
- How to evaluate success as a critical part of modern B2B marketing
- A measurement framework and tips on getting started and governing
The counterintuitive challenge with marketing measurement in B2B is that we’ve never had access to so much data. We have sales data, website data, social data, advertising performance data, search data, CRM data and much more. In many ways it’s never been easier to track & measure, but harder than ever to make truly meaningful goals and honing in on the right measurements.
What’s the goal?
Setting goals and getting measurements right are one of those topics that look simple on the surface (we just have to GROW, okay?), but it’s devious and it holds lots of opportunities to get things wrong.
We have three principles to getting marketing goal-setting right:
- Get as close to revenue as possible without losing the causal link
- Set goals with organisational tension
- Rather measure the right thing inaccurately than measure the wrong thing exactly right
“You get what you measure”, as the saying goes. And nowhere is this more true than with sales & marketing, especially if you tie financial incentives into it for your team. Want more leads? You’ll get more leads. Want more qualified sales meetings? Better still. Sales pipeline? New customers? Revenue? Lower CAC? Now you’re talking.
Not everything is equally easy to measure, though. Measuring the number of clicks your ads get, or new leads in your CRM is trivial. You get the number right there, every day. Measuring the exact profit/loss bottom line impact of your lead engine (or nearly any effort, for that matter) is nigh-on impossible, and the further towards the bottom line you go, the weaker the causal link between your actions and the holistic outcomes get.
As such, the first principle is to get as close to revenue as possible, but not without losing the causal link between what you’re doing and the outcome you’re measuring.
Our second principle is to go for goals with tension. What does that mean?
Going to market is a joint sales & marketing effort. So goals should rely on both of these departments. For example, “marketing qualified leads” is a terrible goal. This is partly because it has zero tension; it can be delivered on purely through the work of marketing. It does not require sellers to further qualify, add pipeline value or close deals, which is the whole point.
You solve this by picking goals with “tensions”, goals that are in the middle, right between early engagement and P/L impact:
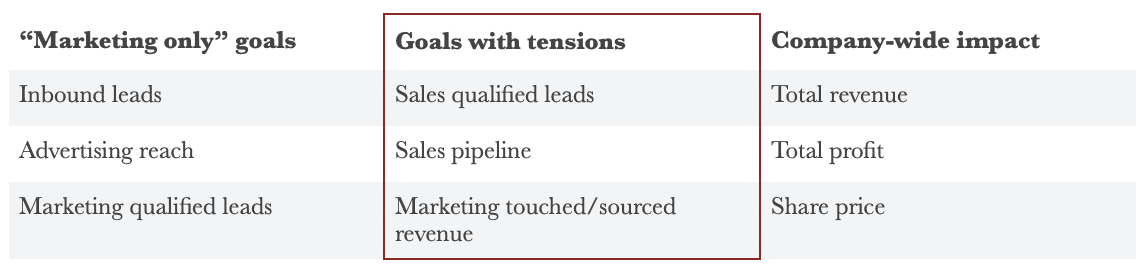
If your marketers complain “but this is a goal I can’t achieve on my own”, they have missed the point; revenue in B2B is a joint sales & marketing effort, and it should be measured as such. Pick a goal from the middle column or a related one that fits your business model.
The third and final principle builds on these “goals with tensions”. Because they’re tricky things to measure! We’ll touch on the attribution challenge later in this article, but even with the best measurement tools in the world, you will fall short of getting an exact measure of “lead sourced revenue”, for example. The reality is often more complex than our systems and understanding allow; the buying process might involve a lot of channels and won’t always accurate attribute value to each of them.
That’s okay: It’s better being mostly right than exactly wrong.
We have to lean into this fact by understanding that the things that matter can’t always be measured exactly.
But rather measure and set goals on these things and accept inaccuracies, because they drive the right behaviour, which is ultimately what goal setting is all about.
Pick goals that are as close to revenue as possible without losing causality, make sure it has organisational tension and accept that you might never get to 100% accuracy in measurement because the goal of goals is not accounting; it’s to drive the right behaviour.
For example, many companies have trouble measuring lead engines on sourced revenue due to very long sales cycles – in this case, move the goalpost one step back to pipeline which materialises much faster or use weighted revenue figures.
We’ll round off this topic with an illustrative example from the call centre business, where agents are extremely behaviour-driven by the metrics they get assigned:
A call centre manager wanted to accelerate performance and got a lot of incoming calls. He looked at his dashboard. One of the metrics that are easily measured there is the amount of time an average call takes, and how many calls each agent has done. So he set ambitious goals for each agent to take a certain amount of calls per day, to incentivise them to solve issues as fast as possible.
It did not go as planned.
The agents quickly caught on to this. They picked up the phone, then immediately hung up. The customer would inevitably call back, thinking there had been a mistake or a dropped call. On the second call, the agent would help them. Now, instead of one call, the agent finished two calls in nearly the same time, contributing much more to his performance.
“You get what you measure” is how we started this section. The call centre manager wanted more calls, faster, and he got them. But it certainly didn’t drive the right behaviour in the end.
The tools and methods of marketing measurement
With the right goal & tracking mindset in place, let’s talk about tracking, and five ways of going about it:
- On-platform data (CRM, web analytics etc.)
- Multi-touch attribution modelling
- Manual analysis or self-reported attribution
- Brand and funnel studies
- Econometrics and marketing mix modelling
We’ll cover each of these five below, including their strengths and weaknesses and how they apply to different types of businesses:
On-platform data
The most basic way to get marketing measurements are from the tools you or your team likely already use every day; your CRM, your web analytics etc. Here’s what to consider if you’re using these platforms to report metric:
Beware of advertising platforms and their own reporting. As a general fact, Facebook, Google, LinkedIn etc. tend to over-attribute. Their incentive is obviously to show as many results as possible – to the extent that some of them employ “view-through” conversions (if you’ve seen an ad and convert, it’s because of that ad!), which obviously over-state the effects of marketing.
Web analytics platforms are generally poor for outcome-based measurements unless you have direct business happening on the website (e.g. conversions to sales or very qualified lead interactions), and is often better represented by data the rest of the organisation has access to and can verify (e.g. CRM). Web analytics are furthermore challenged by the on-going effort of legislators and Apple to increase privacy and restrict personal data capture, making them inaccurate for goals and more meaningful for leading indicators.
CRM has a much more tricky attribution. Most CRM setups bring in leads under a single campaign. Which means a lead is either generated by the website, a salesperson, a campaign or something else. This goes against everything we know about marketing in B2B; long buyer journeys, many different channels working in unison, complex buying groups and accounts etc. While this is clearly the easiest way to track anything, it will most often under-attribute the value of marketing, as assisting touches are given no weight.
Marketing platforms give easy access, but be extremely careful with how they measure and the validity of data.
Multi-touch attribution modelling
If you want to be a little bit controversial, the essence of attribution modelling is this: The data you’re looking at today is wrong. By spending time and energy on attribution modelling, you can make it less wrong, if you get it right.
But before we get too critical or philosophical, let’s dig into why we need attribution modelling at all with some examples:
- You run a campaign on LinkedIn and get 100 leads that turn into 5 opportunities and $1m. Great, right? Except it’s probably not the only thing your company does, and now you’re left with a lot of open questions: how many of those opportunities would’ve come anyway? Did it also influence other opportunities that were not directly converted by this campaign? What other activities contributed to its success?
- You look into your sales pipeline and there’s a massive opportunity with no source on it. Did your sales guy just stamp it out of the ground from nowhere? Have we had contact with the decision-maker before? How many other people in the same account have we touched to enable the direct outreach?
Attribution modelling attempts to answer these and many more questions by capturing as many touch points and parts of the journey as possible, matching them to unique contacts and accounts, and then applying a model to estimate value.
The starting model is what’s known as “last click” and essentially how most leads are counted in B2B today. We don’t know everything about marketing, but we know for sure that this is a deeply flawed model that doesn’t account for multiple people researching in accounts, having several touch points before converting and more.
Instead of applying last click, attribution model software then applies either a pre-built alternative like linear models (all touch points given equal weight), a first-touch leaning one (the initial touch is given most of the value), or a custom one for your business, preferably informed by your own data.
This way, you can uncover value in “underperforming” campaigns that play a role earlier in the funnel, or downplay campaigns that only look strong on last click models, which typically include things like branded keywords on Google. Obviously, someone searching for “buy company name” has been exposed to other things beforehand.
This is a dream for many commercial teams. And probably a worthwhile effort to at least think about for a lot of companies. If you have the data and the right implementation, you might be able to uncover significant improvements in your channel mix or understanding of the buying process.
A word of caution, however. There are a host of reasons why this is not particularly widespread yet:
- Complexity in implementation. If you’re using a simple CRM structure and you have 3 marketing channels that are all online, great. If you’re a larger, complex organisation with many offline activities, direct sales engagements, ecosystem partners etc., be ready for a difficult project with many data gaps along the way. You’re also adding new software to a stack that may be bloated already.
- Complexity with internal stakeholders. Getting a commercial organisation onboard with anything is difficult, and attribution models are no exception. A lot of people internally will not understand what’s going on.
- Data quality is going the wrong way. With cookie limitations, GDPR and Apple privacy efforts, you’re going to face headwinds on data collection.
- How do you really know the new model is better? You’ve hopefully made wrong data less wrong. But you could have also made it more wrong. There is no easy way of knowing.
In conclusion, should you make an effort to test the waters with attribution modelling? Yes, if your data is approachable, you have meaningful volume, channels to mix between and you have the resources, give it a go with the purpose of making yourself smarter and optimising your lead engine efforts. It’s not an ultimate truth or a new “big green number” you can show off – it’s a springboard for even better analysis, evaluation and discussion.
Manual analysis and self-reported attribution
In a company of 15 people and 2 new customers every month, attribution is not a problem. You just ask every single customer, or unpack every single customer journey. With a little work, you can often get a pretty good idea of what happened, when and how.
Obviously, this doesn’t scale to thousands of opportunities, but the principle does. Doing manual analysis, customer interviews and buyer journey research can help uncover many of the things data-driven models cannot.
Word of mouth, online recommendations, personal networking, social, content consumption, PR and more often show up in these types of research.
But be careful; while this method uncovers great qualitative learnings, human memory and ability to explain why they did anything is famously flawed. Don’t rely solely on this method but use it to inform your overall understanding of how marketing drives revenue, and especially to be curious about the less easily tracked things you do.
Brand & funnel research
One of the more traditional ways of measuring particularly brand metrics, is surveying buyers on what brands they know, would consider, prefer, have bought and recommended. In many ways, this is a great and relevant piece of information to both drive marketing strategy (where should we focus in the funnel?) and measure results (did we increase consideration in industry X?).
However, in B2B, there are some complicating factors and considerations:
- Funnels are more unique. While the classic brand awareness / consideration / preference / purchase funnel is fine for most consumer industries, B2B is different. Buyers may not be problem aware, or they may not even be able to buy. You have to make your funnel unique to your business and industry.
- Buyers can be very hard to find and recruit for surveys. Looking to measure brand awareness for Burger King vs McDonalds? Easy. But what if you’re selling advanced manufacturing equipment to a very wide variety of buyers in different industries and roles? Market research firms are typically very poor at uncovering these profiles, or you end up paying large amounts for it, making it impractical for repeating analysis.
One of the more recent ways to continuously research brand metrics, is through Share of Search. Its free, simple and you can do it as many times as you want. By comparing search volume for different brands over time, you can uncover one critical part of the funnel in direct relation to customers:

Recent research by Binet & Field has demonstrated a strong correlation between brand searches and business growth, so it may be one path worth exploring if your industry has active brand searches.
Econometrics and marketing mix modelling
The core “How do we measure the impact of one particular thing in a complex system with many variables”-question is not new.
In 1971, the group winning the Nobel Prize in economics pioneered one way to approach this exact question, using the field of econometrics. In very simple terms, econometrics uses what is called a (multiple) regression model to test hypotheses based on large sets of data.
The practical application of this in a sales and marketing context is called “marketing mix modelling”, where users of the methodology measure an outcome (typically sales or market share) through a large amount of input data, like advertising, shelf space, promotions, channel activity, website visits, leads and much more. A good marketing mix model with a lot of data from years of analysis can separate the effects of each of these and tell you what portion of sales is “baseline” – e.g. what we would sell if we did nothing, and what parts of the “incremental” sales come e.g. from TV advertising.
In our context, we could ask ourselves this; what drives the revenue of our business? There are probably countless factors, but what we’re really looking to isolate here is the specific outputs of our marketing efforts. For example, we could look at raw incoming leads or sales qualified leads, and whether or not these correlate with business growth with a certain time lag variable.
The strength of marketing mix modelling is that it doesn’t rely on pixels, cookies and the proper connections being made in CRM. Instead of looking at the problem “bottom-up” like attribution modelling, it starts “top-down” instead and asks simple questions like “does revenue go up when we get more leads – keeping all other things equal?”.
The weakness of the approach is the age-old challenge of correlation vs causality – you’re building a model built on historical data after all. You run the risk of overfitting the model and not getting a tool that can actually say something about the future – “if I get 50% more leads, what happens to my revenue”?
Traditionally, marketing mix modelling has been very popular in B2C and retail in particular. There is a world where it might play a bigger role in B2B as “bottom-up” becomes weaker and buying journeys become more complex and untraceable. It’s particularly relevant if you have the following characteristics:
- Problems tracking outcomes due to poor “bottom-up” data and gaps in your multi-touch attribution
- Large volumes of well-documented, time-stamped data for 3+ years. E.g. weekly sales per channel, media spend, incoming leads etc.
- Willingness to invest time and effort into both building the model but also keeping it alive over time to improve it and verify its ability to be predictive
- Marketing as a significant portion of your go-to-market – to ensure strong signals.
If these things are true for you, econometrics are unique in the sense that they don’t just explain the current world, but are able to give predictions towards the future.
Getting started with a measurement framework
Start with the main business goals you’re trying to achieve, then work backwards into marketing objectives, channel measurements and data points. A generic example is shown below:
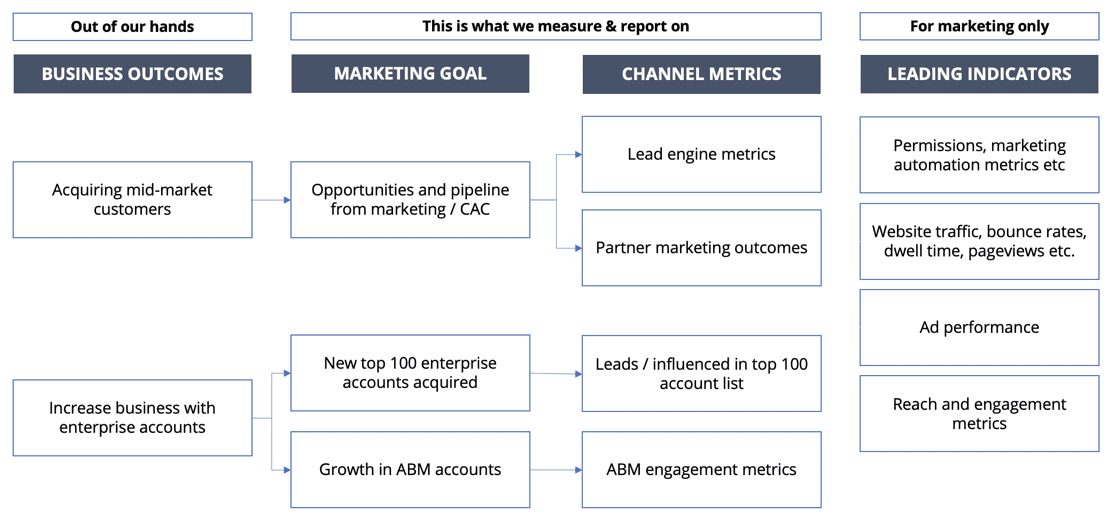 What this accomplishes is two things;
- You establish a logic and connection from business outcomes to marketing goals and metrics. Sometimes the data between these goals are transparent, and in some industries its not. But the logic has to be in place.
- You clearly separate what metrics are for your own analysis and background, and which are for management teams, goal setting etc.
The most important thing here is not getting caught in minutiae of trackability, but establishing the strong logic and connection between what marketing can influence and how.
Putting into practice and governance
With the right goal, measurement framework and tracking method, it’s time to put into practice in the organisation to make it sticky;
- Embedding into your marketing strategy and budget timeline. Goals for the coming year should be in conjunction with the budget and strategy you set out.
- Set out and commit to regularly communicate the metrics marketing owns to relevant stakeholders, including your analysis or what is happening and why. We strongly believe that marketing must own their own narrative and reporting, to avoid it becoming a game of opinions and who shouts the loudest in the board room.
- Making goals and tracking a natural part of on-going governance. Whether you’re looking at marketing performance market-by-market, or by business unit, marketing metrics have to be a natural part of your normal review cadence, whether that’s quarterly business reviews, half-yearly governance or the like.
Goals and measurements are only useful if they drive the right behaviour, which ultimately requires that they become part of how you run marketing as a whole. Running marketing by the numbers is a transformative effort and requires more than just a smart dashboard, but the commitment to moving closer to measuring true business outcomes and embedding it deeply in how the organisation works.